How to create a crawl report and how to interpret it?
The first step consists of correctly entering the necessary information to create a crawl report.
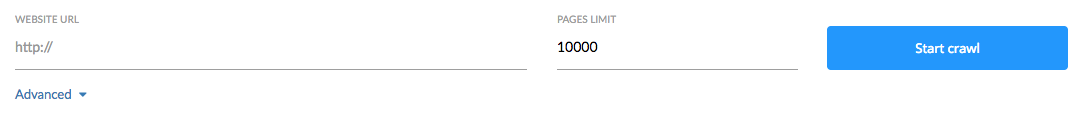
Start by entering the domain URL that you want to analyze. It’s not necessary to specify the protocol (HTTP/HTTPS) since our robot will analyze all detected pages on the site.
Then define the number of pages. Remember that a crawl is a technical check of your website so it is recommended to crawl the entirety of the pages. Choose the number of pages so that your whole site is analyzed.
In the Advanced Options you can choose if you want the crawler to inspect the sitemap or sitemaps of the site.
In the Advanced Options it is also possible to choose to ignore URLs with settings. Remember that URLs with settings are those that contain elements such as “#“ or “?“ and let you specify access requests to a ressource, by filtering information of the page or by loading a page so that the only specific anchor text is displayed.
The second part of using the Crawl tool is related to accessing the analysis report, as shown in the image above.
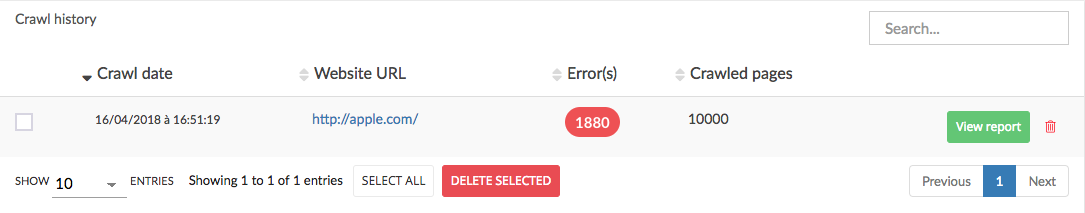
In the table under the creation field you will find all the existing crawl reports.
It is possible to “access“ or “delete“ a crawl report.
Each crawl report is displayed using 4 elements:
- Date of creation
- URL for analysis
- Number of raised errors
- Number of analyzed pages
Opening the report
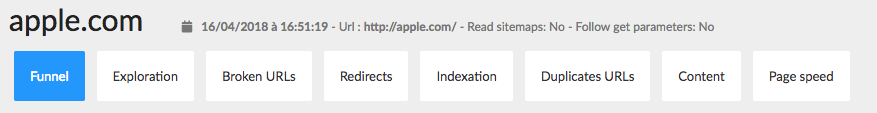
As shown in the image above, once you’ve opened the report you’ll find a reminder of the crawl configuration with: the beginning URL, the advanced options as well as the date the report was created.
You’ll also see the button that lets you export the report, available in PDF or csv.
There are several ways to explore the report: the first consists of navigating the tabs shown above. You’ll find errors grouped by categories:
- Exploration
- Broken URLs
- Redirections
- Indexation
- Duplicate URLs
- Content
- Performance
These categories represent steps, which we’ll look at later on, and which transcribe the processes that Google robots carry out to evaluate a page. Each category looks at a different aspect as shown in the funnel image below:
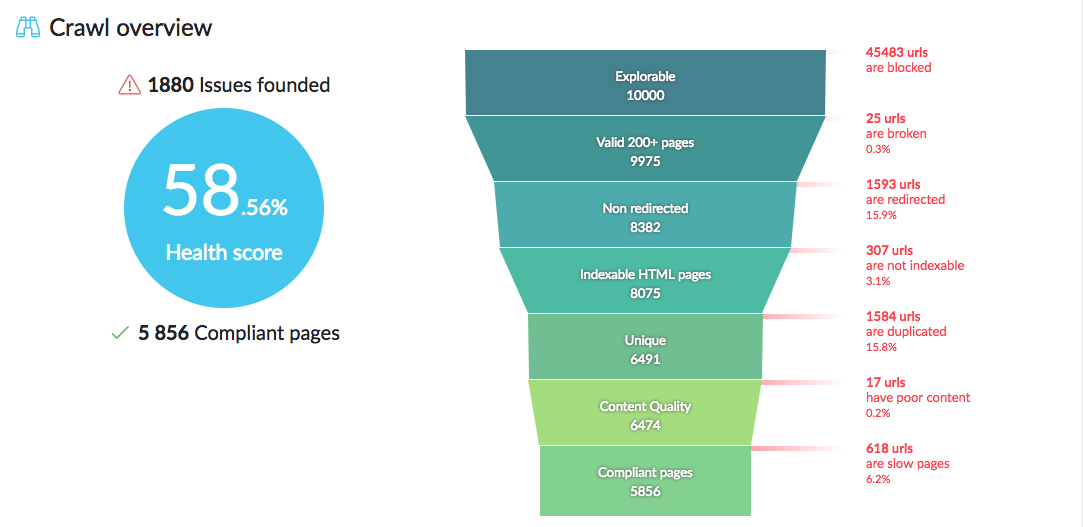
As noted earlier there are several ways to read into a report. The second is linked to this funnel which helps answer some questions. When a page is analyzed by our robots we first look at whether the page is explorable. If the page is explorable and passes this stage, we then analyze the HTTP code returned to see if the URL is broken. Again, if the URL passes this stage it goes to the next step until it passes all steps. If the URL passes all steps then we say that it is “Compliant“, this means that it meets all the defined standards by Google and that the page is correctly optimized. Any URL which does not pass a stage of the funnel is not filtered and is not counted in the analysis. You can find these by clicking directly on the relevant step of the funnel.
To the left of the funnel you will find 3 indicators:
- The number of total detected errors
- The number of “Compliant“ pages
- The Health Score of the site
There is also a button that allows you to start a new analysis in just one click without having to fill in the creation field again. A new analysis updates the information in the report.
The last element of this tab of the crawl report is a list of issues to fix in order of priority (as shown in the image above).
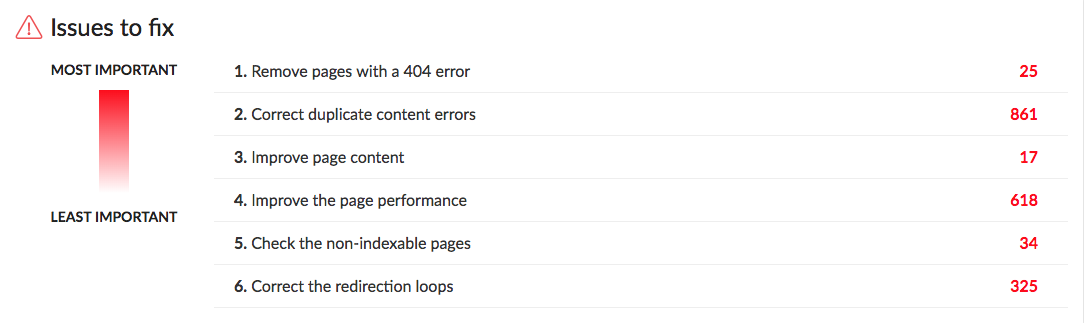
Under the funnel you’ll find a list in order of issues to correct which takes into account the SEO importance of each element analyzed as well as the number of times each error exists.
By clicking on one of the errors you will get an explanation of the error and get the link so that you can access the URLs that have this error.
Tab content
In this section we will explore the previously listed tabs and explain all the information found in them.

Here we see if the analyzed pages are explorable and if they are not, then the reason behind this.
A page that is not explorable occurs because it is:
- Ignored following the Crawl configuration
- Blocked by the Robots.txt
- Blocked by a Nofollow link
- Ignored because the URL is too long (> 4096 characters)
The graph immediately makes it easier to see what pages are explorable vs. non-explorable.
In this table you’ll find a list of analyzed URLs along with the following information:
- concerned URL
- state, explorable or not
- source, where the analyzed URL was found
Broken URLs tab
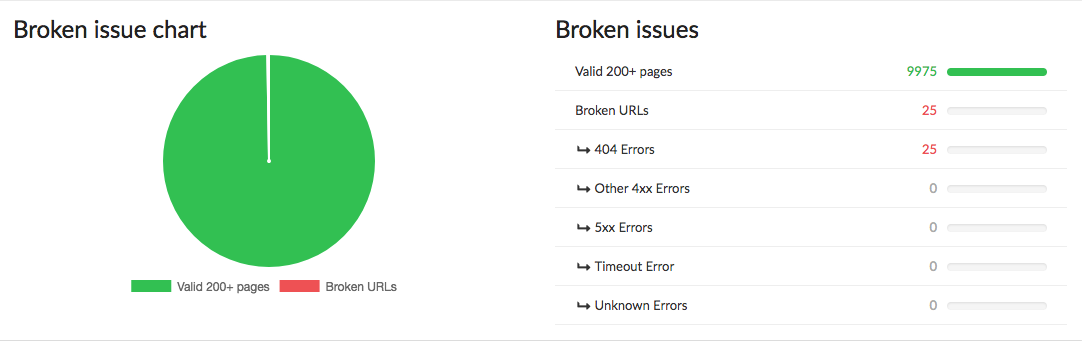
In this section we look at whether the analyzed pages are broken due to one thing or another or if they are valid and send back a 200 code.
- 404 error: error code due to a broken ressource.
- 4XX error: general error code due to issues client-side.
- 5XX error: general error code due to issues server-side.
- Timeout error: full loading time of ressources is longer than 30s.
- Unknown error: all HTTP code errors that don’t often occur.
The graph immediately makes it easier to see the valid vs. broken pages.
In the table you’ll find a list of analyzed URLs along with the following information:
- concerned URL
- state, valid or broken
- source, where the analyzed URL was found
Redirects tab
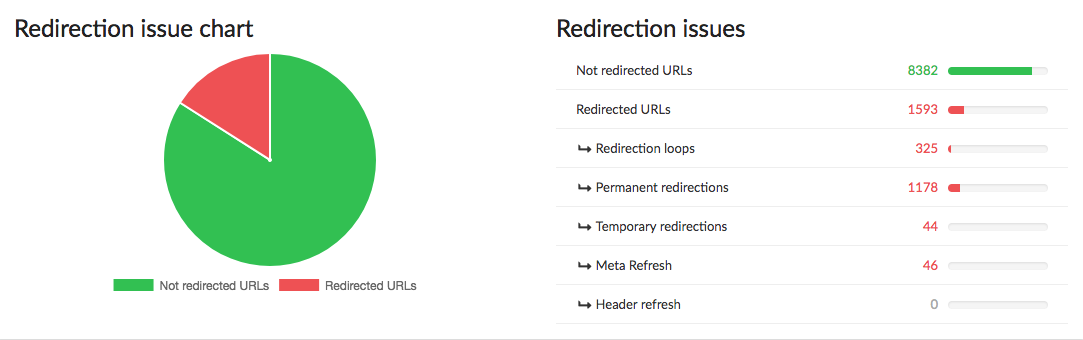
In this section we look at whether accessing a URL is from a redirection or not. A page can be redirected several times and in different ways, here is a list:
- A redirection loop: this is a redirection series of a page to another until it forms a loop.
- A permanent redirection: such as 301, 303 or 308, these indicate that the desired ressource changed URL permanently.
- A temporary redirection: such as 302 and 307, these indicate that the desired ressource is momentarily unavailable, make sure you respect the temporary state of these redirections.
- A meta Refresh: a HTML tab that allows a redirection towards a different URL after a chosen timing.
- A header Refresh: a HTTP header that allows a redirection towards a different URL after a chosen timing.
The graph immediately makes it easier to see the redirection vs. no-redirection pages.
In the table you’ll find a list of analyzed URLs along with the following information:
- concerned URL
- state, a URL with a redirection or not
- source, where the analyzed URL was found
- target, the final destination after the redirection
Indexation tab
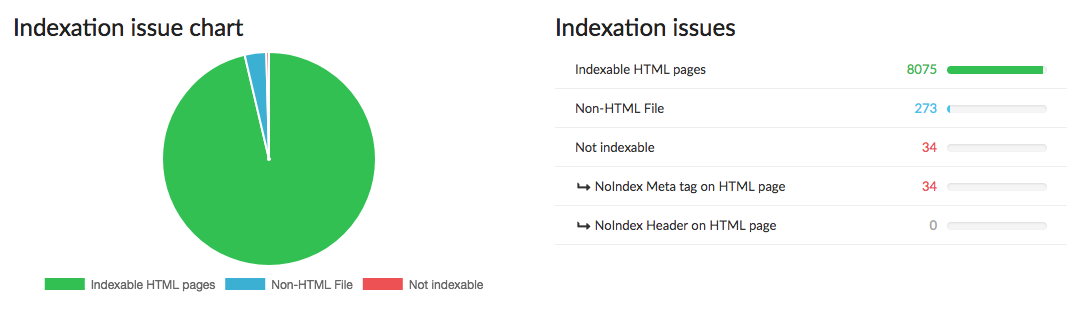
Let’s now look around the indexation tab to answer quite an obvious question of: can my page be indexed in the search engines?
A page is not able to be indexed for different reasons, voluntary or involuntary.
As shown in the image above in this section you’ll find:
Indexable HTML pages.
Non-HTML pages: which are ressources other than web pages, for example PDFs, images, text documents, etc. These files can be indexed but the content isn’t read by Google.
Non-indexable HTML pages which exist for two reasons:
- A noindex HTML tag which can be found on the page and tells the robots to not index the page.
- A noindex HTTP header which can be found at the top of the page and tells the robots to not index the page.
The graph immediately makes it easier to see the indexable vs. non-indexable pages.
In the table you’ll find a list of analyzed URLs along with the following information:
- concerned URL
- state, a URL with a redirection or not
- source, where the analyzed URL was found
Duplicate URLs tab
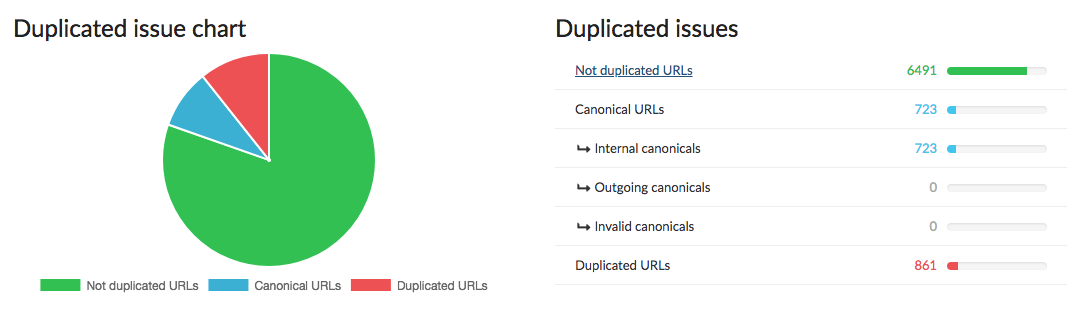
In this section we will talk about duplicate content. Two pages with similar content do not provide any extra information to the user or search engines, and Google principally tends to penalize duplicate content.
Principally indexing only one page out of two but also lowering the value of sites with a lot of duplicate content. One way of fixing duplicate content problems is using the “meta canonical“ tag on a page with the most representative URL of the pages with similar content. The meta canonical is a way of declaring a preferred version of a page in case the indexation robots find that the content of two pages is too alike.
As shown in the image above, in this section you’ll find:
- URLs with an internal meta canonical tag; they refer to an internal page of the site.
- URLs with an outgoing meta canonical tag; they refer to a page of another site.
- URLs with an invalid meta canonical tag; the tag is badly entered, generally in another way than the URL.
- URLs where the content is detected as duplicate.
This graph immediately makes it easier to see the duplicate and unique pages.
In the table you’ll find a list of analyzed URLs along with the following information:
- concerned URL
- state, duplicate content or unique
- canonical URL, if it exists
Content tab
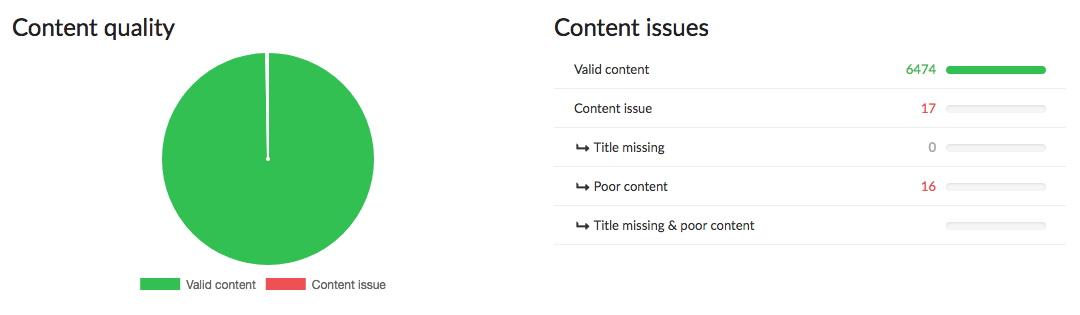
In this section we will talk about content and ask ourselves whether the richness of the content is sufficient.
For this it is worth looking at the number of keywords present in the page content and page title.
As shown in the image above you’ll find:
- Content errors, when the number of unique keywords is lower than 100.
- Title errors, when the page title is missing.
- “Combined“ errors, when the title is missing and the number of unique keywords is lower than 100.
The graph immediately makes it easier to see the pages with content errors vs. no content errors.
In this table you’ll find a list of analyzed URLs along with the following information:
- concerned URL
- state, with or without content error(s)
- number of keywords
- number of unique keywords
- page title (+ number of characters)
Page Speed tab
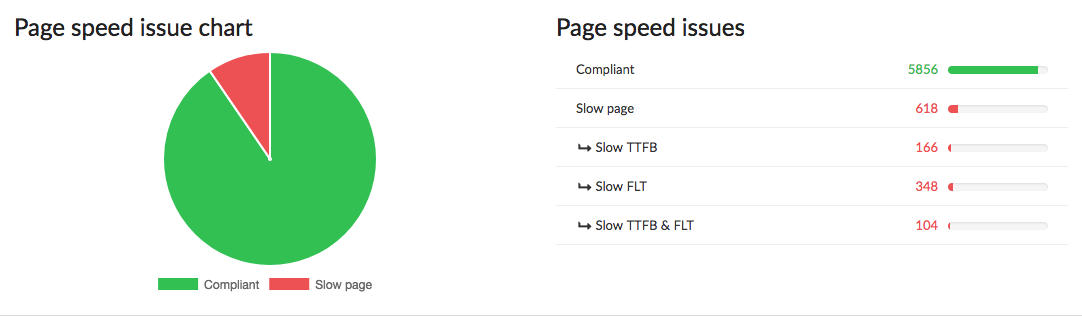
In this last section we’ll look at the loading time of pages so users wait as little as possible for the content to load.
For this we’ll look at several indicators as shown in the image above where you’ll find valid pages regarding their performance but also pages with issues, having not validated this step.
Here are the types of blocking performance errors for this step:
- Pages with a slow TTFB (>800ms, TTFB means “Time to first byte“ and represent the connection time to the server delivering the requested content.
- Pages with a slow FLT (>6s), FLT means “Full load time“ and represents the total loading time of a page and all its ressources.
- Pages with a slow TTFB and FLT.
The graph immediately makes it easier to see the pages with performance issues vs. the pages with no performance issues.
In the table you’ll find a list of analyzed URLs along with the following information:
- concerned URL
- state, with or without performance issues
- TTFB, server connection time in milliseconds
- FLT, full loading time in milliseconds
Now that we have looked at the overall navigation of the crawl report, the next step is looking at the information in the page reports, available for all found URLs during the site’s exploration.
To access the article regarding the information found in the page reports, please go to The Page Report in the Crawl tool; a complete technical check of one URL.
If you have any further questions don’t hesitate to contact out team via the chatbox or email, and we’ll be happy to help!
Gaelle
Comments